The normality of pi is one of the remaining mysteries of the mathematical constant π. To understand the concept better, we first have a look at its irrationality and transcendentality. Finally, a simple check is performed on the newly computed digits of pi, to test wheter they are consistent with the hypothesis of the normality of pi.
Irrationality
In the 18th century, the Swiss mathematician Johann Lambert proved that π is an irrational number. This means that it is impossible to express π as a fraction of two integers. As a consequence, π has an infinite number of digits and does not end in an infinitely repeating pattern of digits. Therefore, the quest of computing more and more digits of π will never come to an end.

Transcendentality
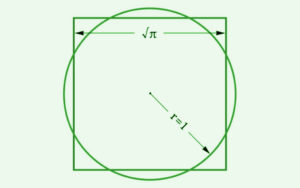
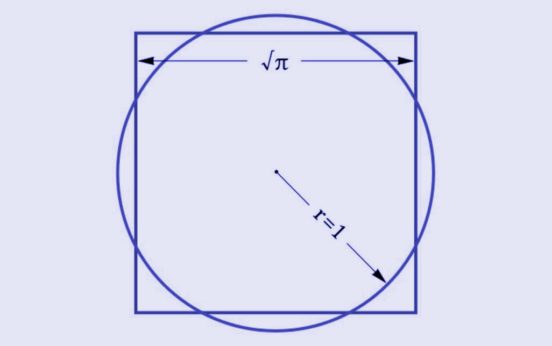
Furthermore, π is known to be transcendental. This does not mean, that it is kind of divine. In mathematics a number is called transcendental if it is not a solution of any polynomial with rational coefficients. As a result, there is no finite formula to compute π from rational numbers and n-th roots. The transcendence of π also implies, that there is no solution to the antique problem of ‘squaring’ the cycle with compass and straightedge alone.
Normality
Despite the extensive knowledge about π, it is still unknown whether it belongs to the set of normal numbers. A number is defined to be normal, if in every base all digits and combinations of digits occur with the same frequency. For the decimal representation of π, this means for example, that all digits from 0 to 9 occur with a probability of 10%. Any combination of two digits, e.g. the sequence ’79’, has to occur with a frequency of 1%, and so on. From the known digits of π, it is supposed that π is indeed normal, but so far nobody was able to prove this hypothesis.
Results on the normality of pi
To check, whether the new digits are consistent with the normality of pi, I computed the frequencies of all digit combinations up to length three in the decimal and hexadecimal representations. As expected, there are no hints of π not being normal in these bases. Assuming the frequencies to follow a binomial distribution, the maximum deviation between the observed and expected variances of the frequency distributions amounts to only 1.33 standard deviations. The details of the analysis can be found at https://arxiv.org/abs/1612.00489v1.


Comments by Pipi